![]()
Here it is! I’m excited to present my first new app in a long, long time! It’s called HyperAltimeter, and it’s all about pressure and altitude, and pushing the limits of what can be done with the new barometer sensor that is embedded in your iPhone 6 or 6 Plus.
Whilst most smartphones are already equipped with GPS receivers, which do provide altitude readings, these are not typically very accurate. The GPS system is designed to obtain your horizontal position to a good degree of accuracy, but accuracy of altitude was not a key design factor.
However, the new barometer sensors are very sensitive, and can detect pressure changes as small as those experienced just by raising the device from your chest level to above your head. This means that it excels at measuring changes in height as you climb stairs, or walk or run a course.
However, longer term changes in pressure due to moving weather systems means that height changes can only be determined accurately over short periods of time, and similarly it also means that your altitude from sea level cannot be determined accurately from barometric data, alone.
The solution to longer term accuracy in height changes and absolute altitude measurement comes from combining the device’s barometric data with weather data i.e. readings of local pressure and temperature.
Amazingly, from first idea to this app becoming available in the app store was just six days! I’ve typically spent one to three months developing each new app, and then many more months, over time, enhancing and refining them. But in this case, by leverage code and experience from my other apps, I submitted the app to Apple after just five days. And then Apple’s approval came within twelve hours. By comparison, review time for app submissions is currently averaging about twelve days. So it seems Apple is especially keen to help along apps that make use of the iPhone 6’s new capabilities.
About the App
This app measures your altitude via three very different means (or via two means if your device doesn’t have a barometer sensor). This allows much greater accuracy than relying only on the device GPS sensor alone to find your altitude.
In fact the standard GPS readings of altitude are far less accurate than the other two methods, so it is provided here mainly just for the sake of comparison.
The three methods are:
- GPS sensor
- Online mapping survey data
- Barometer sensor combined with current local atmospheric conditions
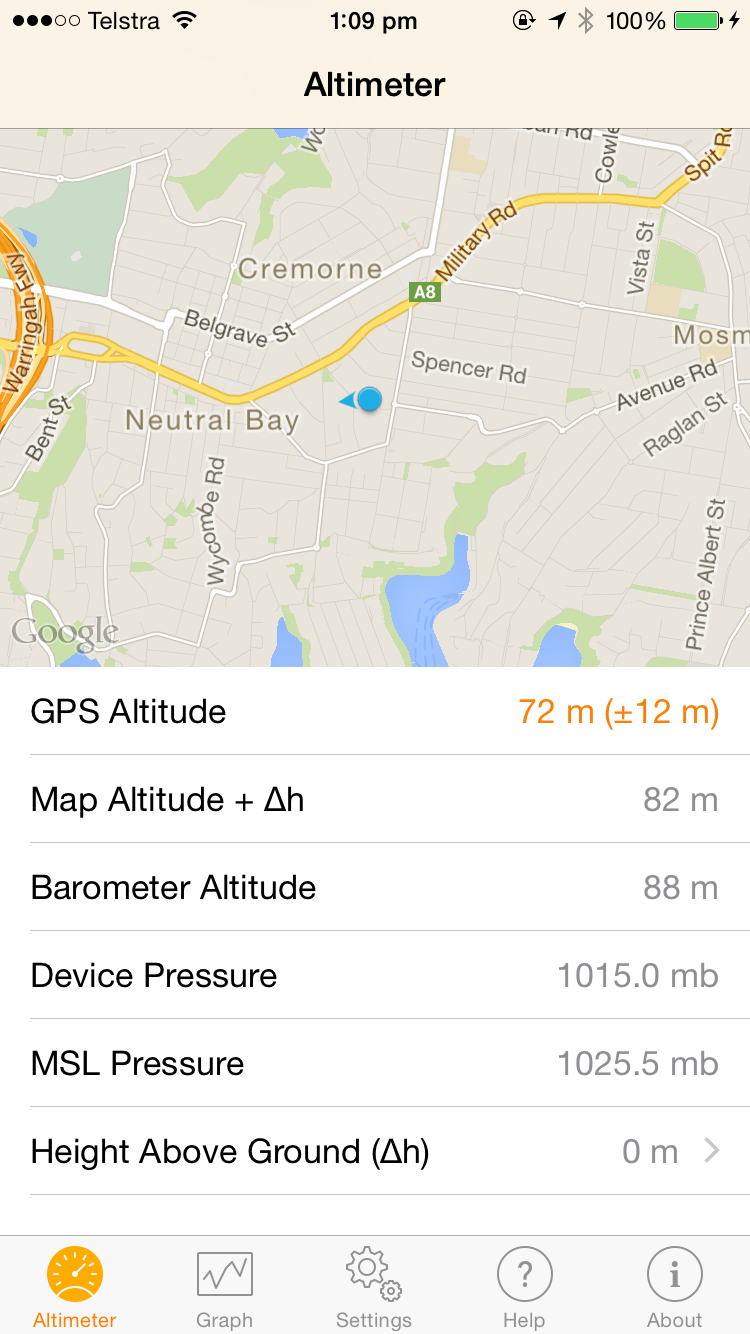
Altimeter Screen
This screen shows all available altitude-related data, as well as showing your current location on a map. The displayed data items are:
- GPS Altitude – this is the altitude from the standard GPS sensor. Note that the given accuracy is one returned by the sensor, although by observation the stated accuracy range is sometimes too small, and does not overlap the more accurate measurement taken via the two other methods.
- Map Altitude + Δh – This shows the altitude for your current location as determined via online mapping data. It is generally very accurate in relation to gound level. If you are in a high-rise, use the Height Above Ground field to enter your local height – this will automatically then be included in the altitude value shown in this field.
- Barometric Altitude – Barometer sensor combined with current local atmospheric conditions (means sea level pressure and temperature), which are then used to calculate your actual altitude. Note – this method is only available on devices which include a barometer sensor.
- Device Pressure – Shows the actual pressure reading from the device barometer, as used in the altitude calculation.
- MSL Pressure – Shows the mean sea level pressure from the nearest available weather observation location, as used in the barometric altitude calculation. Tap on this cell to see detailed information about the local weather data it is currently using.
- Height Above Ground (Δh) – this is a value you must enter yourself, if you are in a high-rise building or otherwise abve local ground level, and is used to refine the the Map Altitude calculation, above.
Graph Screen
This view allows you to see how altitude is changing with time, via a constantly updating graph. The three option are:
- GPS Altitude – Shows the altitude data returned by the device GPS sensor.
- Barometric Altitude – Barometer sensor combined with current local atmospheric conditions (means sea level pressure and temperature), which are then used to calculate your actual altitude. This value is retrospectively adjusted when each new local mean sea level pressure reading is obtained, to take account of the atmospheric pressure trend. Due to these adjustments, this graph should show reasonable stability over the long term.
- Δ Altitude – Shows the relative difference in altitude from when you first started the app, or tap the reset button, based on changes in pressure. This is very accurate for measuring short-term altitude changes, such as going up or down stairs, taking short walks or runs across terrain etc. Over longer time periods it will likely suffer from drift due to changes in atmospheric pressure, due to moving weather systems. For this reason you may want to reset this graph just before using it to make a measurement of change in your altitude.
- Pressure – Shows the raw pressure readings from the barometer in your device. This value changes over time for two reasons – one is when you move up or down, as pressure changes with your altitude, and the other is changes in local atmospheric pressure due to weather systems and wind gusts. If you keep the device stationary, then this graph will reflect only atmospheric pressure changes.


So what are you waiting for? Go and get it from Apple’s app store!
